


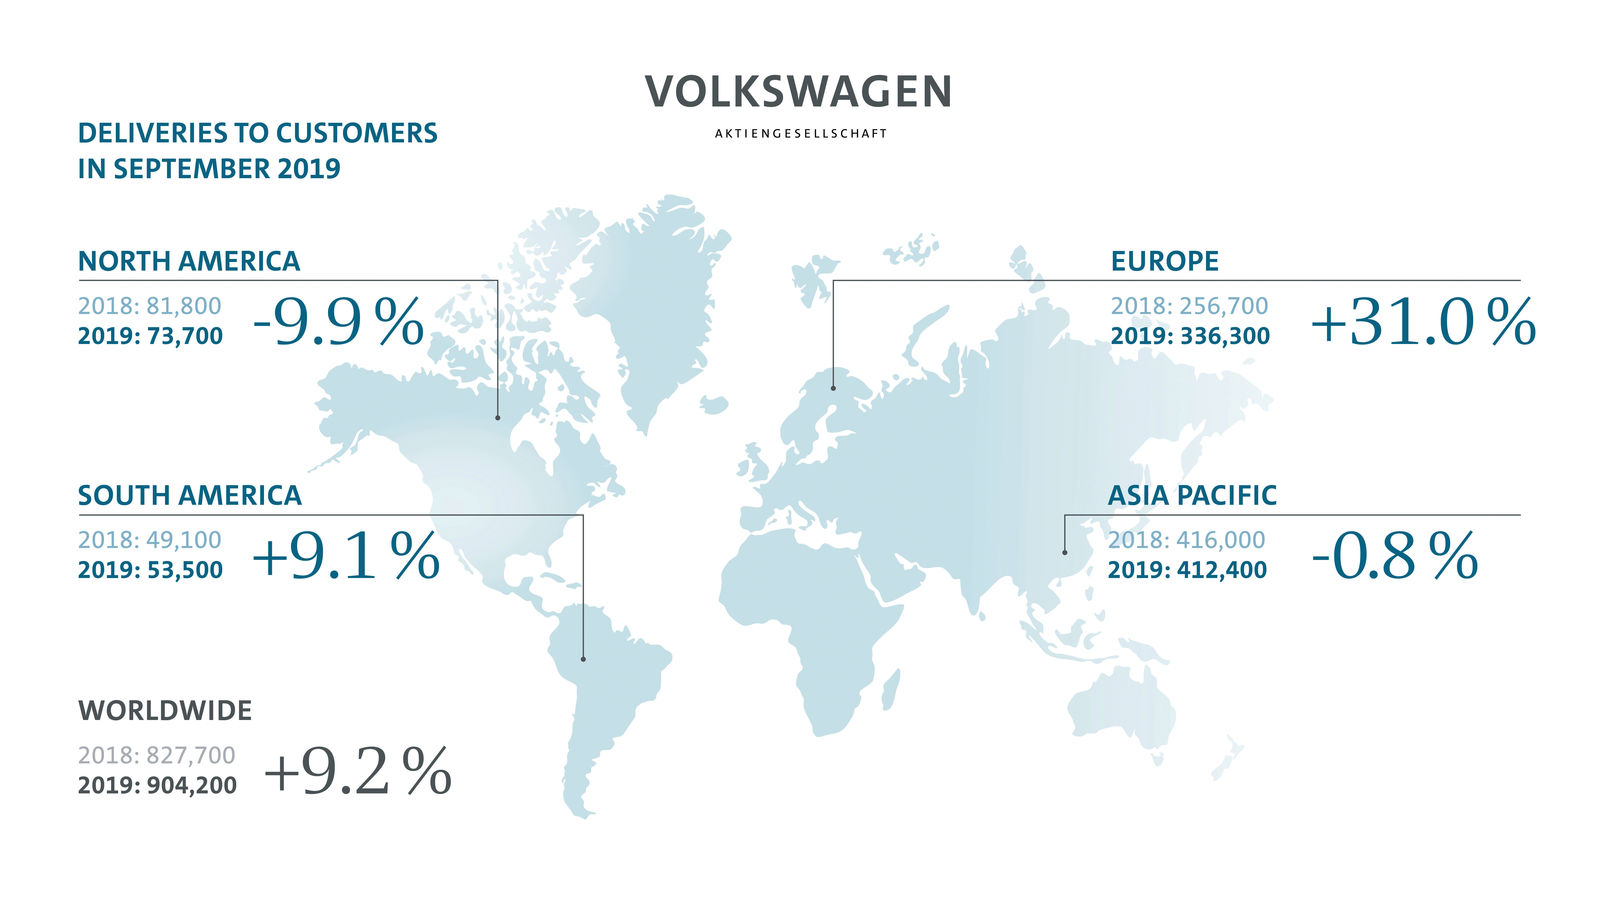
In detail, deliveries in the regions in September developed as follows:
in Europe, 336,300 vehicles were delivered, corresponding to a rise of 31.0 percent compared with September 2018, when deliveries were at a low level as a result of the WLTP changeover. The same effect can be observed in Western Europe, where deliveries rose by 36.6 percent to 272,600 vehicles. On this basis, the Volkswagen Group significantly expanded its market share both in Western Europe and in Europe as a whole compared with last year. In the domestic market of Germany, there was also a significant rise compared with last year. Here, 92,800 group vehicles were handed over to customers (+58.1 percent). In Central and Eastern Europe, deliveries rose to 63,700 vehicles (+11.5 percent). In Russia, the Group brands handed 20,400 vehicles over to customers, 3.7 percent fewer than in September 2018.
In North America, overall markets shrank. The Group brands were also affected by this trend, but they succeeded in slightly expanding their market share. Deliveries fell by 9.9 percent to 73,700 vehicles. In the USA, 48,900 vehicles were handed over to customers, a fall of 11.5 percent.In Canada, deliveries amounted to 10,500 vehicles, a drop of 2.6 percent. In Mexico, 14,300 customers of a Group brand took delivery of a vehicle (-9.3 percent).
In South America, the Group succeeded in boosting deliveries markedly in contrast to the shrinking overall market and therefore significantly expanded its market share. Deliveries rose by 9.1 percent compared with September 2018 to 53,500 vehicles. While deliveries in Argentina fell by 20.1 percent to 6,100 vehicles in an overall economic environment that was challenging, there was a rise of 14.8 percent to 41,000 vehicles in Brazil.
The Asia-Pacific region recorded a slight fall of 0.8 percent to 412,400 vehicles delivered. In China, the Group’s largest single market, deliveries, at 384,100 vehicles, slightly exceeded the prior-year level (+0.2 percent). In a shrinking overall market, the Group therefore significantly boosted its market share.
| Deliveries to | Sep. | Sep. | Change (%) | Jan.-Sep. 2019 | Jan.-Sep. 2018 | Change (%) |
| Europe | 336,300 | 256,700 | +31.0 | 3,445,000 | 3,412,400 | +1.0 |
| Western Europe | 272,600 | 199,600 | +36.6 | 2,853,900 | 2,819,000 | +1.2 |
| Germany | 92,800 | 58,700 | +58.1 | 1,034,400 | 1,007,300 | +2.7 |
| Central and Eastern Europe | 63,700 | 57,100 | +11.5 | 591,100 | 593,400 | -0.4 |
| Russia | 20,400 | 21,100 | -3.7 | 164,800 | 161,100 | +2.3 |
| North America | 73,700 | 81,800 | -9.9 | 702,900 | 713,300 | -1.5 |
| USA | 48,900 | 55,300 | -11.5 | 485,000 | 478,600 | +1.3 |
| South America | 53,500 | 49,100 | +9.1 | 447,000 | 436,400 | +2.4 |
| Brazil | 41,000 | 35,700 | +14.8 | 341,100 | 284,600 | +19.9 |
| Asia-Pacific | 412,400 | 416,000 | -0.8 | 3,167,500 | 3,296,600 | -3.9 |
| China (incl. HK) | 384,100 | 383,500 | +0.2 | 2,955,200 | 3,039,800 | -2.8 |
| | | | | | | |
| Worldwide | 904,200 | 827,700 | +9.2 | 8,005,300 | 8,130,600 | -1.5 |
| Deliveries to | Sep. | Sep. | Change (%) | Jan.-Sep. 2019 | Jan.-Sep. 2018 | Change (%) |
| Volkswagen Passenger Cars | 533,600 | 485,000 | +10.0 | 4,514,600 | 4,622,800 | -2.3 |
| Audi | 145,400 | 139,200 | +4.5 | 1,357,100 | 1,407,700 | -3.6 |
| ŠKODA | 102,000 | 94,800 | +7.5 | 913,700 | 939,100 | -2.7 |
| SEAT | 43,300 | 31,600 | +36.9 | 454,900 | 415,600 | +9.5 |
| Porsche | 24,300 | 20,200 | +20.4 | 202,300 | 196,600 | +2.9 |
| Volkswagen | 33,200 | 35,400 | -6.1 | 369,800 | 371,800 | -0.5 |
| MAN | 11,600 | 11,800 | -1.9 | 104,400 | 97,700 | +6.8 |
| Scania | 9,000 | 8,400 | +6.0 | 74,700 | 68,600 | +8.9 |
| | | | | | | |
| Volkswagen Group (total) | 904,200 | 827,700 | +9.2 | 8,005,300 | 8,130,600 | -1.5 |