


Wolfsburg. The Volkswagen Group Annual Media, Analyst and Investor Conference took place on March 10, 2026.
“In 2025 we put the new strength of the Volkswagen Group on the road and kept our company firmly on track, despite increasing global headwinds. We saw strong market demand for our innovative, exciting products, which won numerous prestigious awards. With state-of-the-art technologies, that make our customers’ everyday lives easier, safer and more comfortable. We have demonstrated that our substance is robust and that our future-oriented programs are working. Supported by strong financial momentum at year-end, we further strengthened our company. After three intensive years of realignment within the Volkswagen Group, we are seeing tangible progress. At the same time, we are operating in a fundamentally different environment. We are therefore determined to continue to pursue the course we have set. All the more reason for us to now enter the next phase of our transformation: adapting our business model to new conditions, expanding our regional footprint, continuing our disciplined work on saving costs, and delivering cutting-edge products. In 2026, we will launch affordable electric mobility with premium technology. In the Chinese market, we will start the largest product campaign in our history. And we will set key milestones for batteries, software and autonomous driving on our path to becoming the global automotive technology driver.”
“2025 was shaped by geopolitical tensions, tariffs and intense competitive pressure. In this demanding environment, we launched 30 new models, made visible progress with our restructuring, generated solid net cash flow and thus kept our net liquidity stable at a solid level. These were important steps to further boost the Volkswagen Group’s resilience. But the operating margin of 4.6 percent adjusted for restructuring is not sufficient in the long run. In this challenging environment, we want to keep our combustion engine vehicles technologically competitive, continue investing in exciting electric vehicles and the latest software solutions for our customers, and expand our regional presence, particularly in the United States. We can only realize this if we continue to rigorously reduce costs, leverage Group synergies, reduce complexity and thus sustainably increase profitability. This is what we will focus on in the coming months.”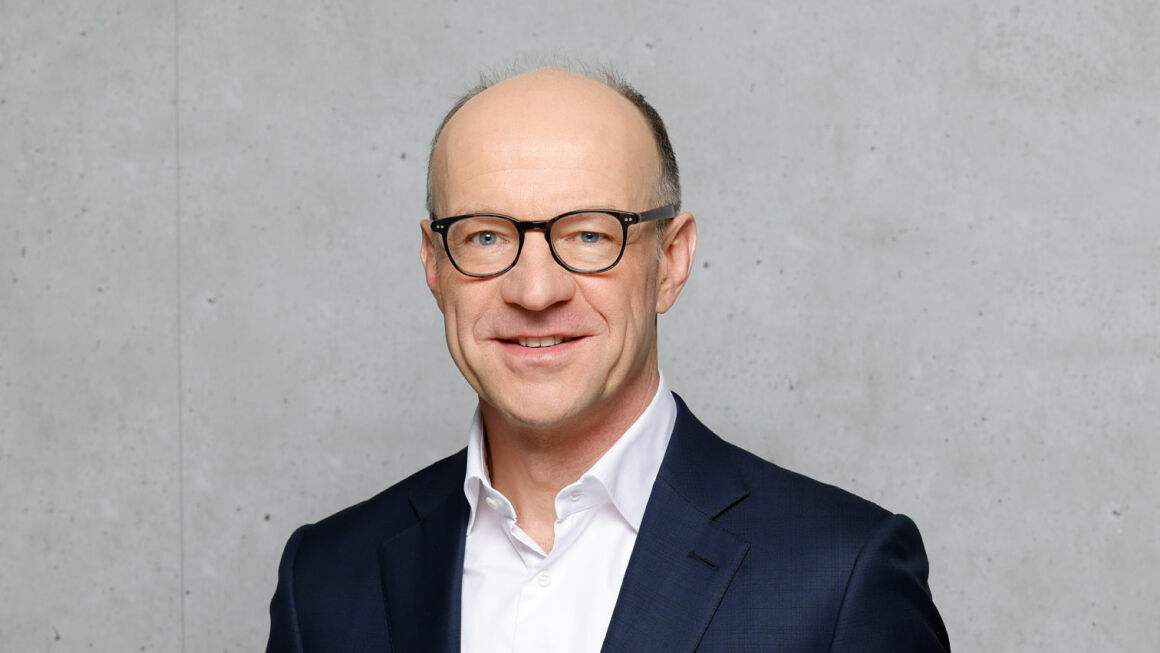
Key Figures
Dividend

Outlook for 2026
The Volkswagen Group expects sales revenue in 2026 to develop within a range of 0 and +3 percent compared with the previous year. The Group’s operating return on sales is expected to range between 4.0 and 5.5 percent.
In the Automotive Division, the company expects an investment ratio of between 11 and 12 percent in 2026. Net cash flow for the year 2026 is expected to range between EUR 3 billion and EUR 6 billion. Net liquidity in the Automotive Division is expected to range between EUR 32 billion and EUR 34 billion in 2026. The Volkswagen Group continues to pursue its objective of maintaining a solid financing and liquidity policy.
Challenges are expected in particular from the macroeconomic environment, uncertainties regarding restrictions in international trade and geopolitical tensions, increasing competitive intensity, volatile commodity, energy and foreign exchange markets, as well as high requirements resulting from emissions-related regulations.
The forecast is based on the assumption that the current tariffs in international trade will remain in place.
Further information on the brand groups
Core
2025 Results Core
Progressive
2025 Results Progressive
Sport Luxury
2025 Results Luxury
TRATON Group
2025 Results TRATON Group
CARIAD
Group Mobility
2025 Results VW Group Mobility
Key Figures Volkswagen Group
Q4 | FY | ||||||
2025 | 2024 | % | 2025 | 2024 | % | ||
Volume Data1 in thousands | |||||||
Deliveries to customers (units) | 2,380 | 2,502 | -4.9 | 8,984 | 9,027 | – 0.5 | |
Vehicle sales (units) | 2,441 | 2,574 | -5.1 | 9,022 | 9,037 | -0.2 | |
Production (units) | 2,222 | 2,322 | -4.3 | 8,866 | 8,954 | -1.0 | |
Employees (on Dec. 31) | 662.9 | 679.5 | -2.4 | ||||
Financial Data (IFRS), € million | |||||||
Sales revenue | 83,245 | 87,377 | -4.7 | 321,913 | 324,656 | -0.8 | |
Operating result | 3,460 | 6,248 | -44.6 | 8,868 | 19,060 | –53.5 | |
Operating return on sales (%) | 4.2 | 7.2 | 2.8 | 5.9 | |||
Earnings before tax | 3,248 | 4,398 | -26.1 | 9,307 | 16,806 | –44.6 | |
Return on sales before tax (%) | 3.9 | 5.0 | 2.9 | 5.2 | |||
Earnings after tax | 3,499 | 3,558 | -1.7 | 6,904 | 12,394 | –44.3 | |
Automotive Division2 | |||||||
Cash flows from operating activities | 12,475 | 12,754 | -2.2 | 31,406 | 34,263 | – 8.3 | |
Cash flows from investing activities attributable to operating activities3 | 7,826 | 10,944 | -28.5 | 24,961 | 29,077 | - 14.2 | |
Net cash flow | 4,649 | 1,811 | +156.8 | 6,445 | 5,186 | 24.3 | |
Net liquidity at Dec. 31 | 34,497 | 34,414 | 0.2 | ||||
Investment ratio | 13.0 | 14.5 | 11.8 | 13.0 | |||
1) The figures also include the equity-accounted Chinese joint ventures. Prior-year deliveries have been updated to reflect subsequent statistical trends.
2) Values correspond to the reporting structure applicable since 2025.
3) Excluding acquisition and disposal of equity investments: Q4 EUR 7,835 (9,605) million, January to December EUR 23,462 (26,487) million.
Key figures by brand group and business field from January 1 to December 31
Vehicle sales | Sales revenue | Operating result | Operating margin | |||||
Thousand vehicles/ | 2025 | 2024 | 2025 | 2024 | 2025 | 2024 | 2025 | 2024 |
Core brand group | 5,125 | 4,960 | 145,202 | 140,004 | 6,821 | 6,961 | 4.7 | 5.0 |
Progressive brand group | 1,145 | 1,123 | 65,503 | 64,532 | 3,371 | 3,903 | 5.1 | 6.0 |
Sport Luxury brand group1 | 266 | 313 | 32,185 | 36,438 | 90 | 5,286 | 0.3 | 14.5 |
CARIAD | – | – | 1,775 | 1,327 | -2,180 | -2,431 | – | – |
Battery | – | – | 30 | 8 | -1,386 | -1,053 | – | – |
TRATON Commercial Vehicles | 306 | 335 | 42,540 | 46,183 | 2,411 | 4,204 | 5.7 | 9.1 |
Equity-accounted companies in China2 | 2,588 | 2,742 | – | – | – | – | – | – |
Volkswagen Group Mobility | – | – | 57,769 | 54,806 | 3,451 | 3,000 | 6.0 | 5.5 |
Other3 | -407 | -435 | -23,092 | -18,643 | -3,314 | -401 | -14.4 | -2.2 |
Volkswagen Group | 9,022 | 9,037 | 321,913 | 324,656 | 8,868 | 19,060 | 2.8 | 5.9 |
1) Including Porsche Financial Services: sales revenue EUR 36,272 (40,083) million, operating result EUR 413 (5,637) million.
2) The sales revenue and operating result of the equity-accounted companies in China are not included in the consolidated figures; the share of the operating result generated by these companies amounted to EUR 958 (1,742) million.
3) In the operating result, mainly intragroup items recognized in profit or loss, in particular from the elimination of intercompany profits; the figure includes depreciation and amortization of identifiable assets as part of purchase price allocation, as well as companies not allocated to the brands.
Overview:
1. What does the 2025 annual report reveal about the Volkswagen Group's financial situation?
Revenues remained stable, the operating profit dropped sharply due to tariffs and special effects, while net cash flow and liquidity stayed solid.
2. How is the Volkswagen Group developing strategically and technologically?
In 2026, the Group is focusing on affordable electric mobility, strengthening software and battery technologies, and launching the largest product offensive in its history in China.
3. What are Group's expectations for 2026?
Volkswagen Group anticipates sales revenue of between 0 and +3 percent, an operating return of 4.0–5.5 percent, and continued stable liquidity despite a challenging global environment.

The Group Strategy
With "The Group Strategy – Mobility for Generations", the Volkswagen Group is pursuing a clear strategic roadmap up to 2035. The claim: to play an active role in shaping the transformation of the automotive industry – as "The Global Automotive Tech Driver". On our way to becoming the Global Automotive Tech Driver, we can build on a unique basis as a company: Our global presence, our strong brands and our diverse teams. These are the foundation of our strategic target picture.