





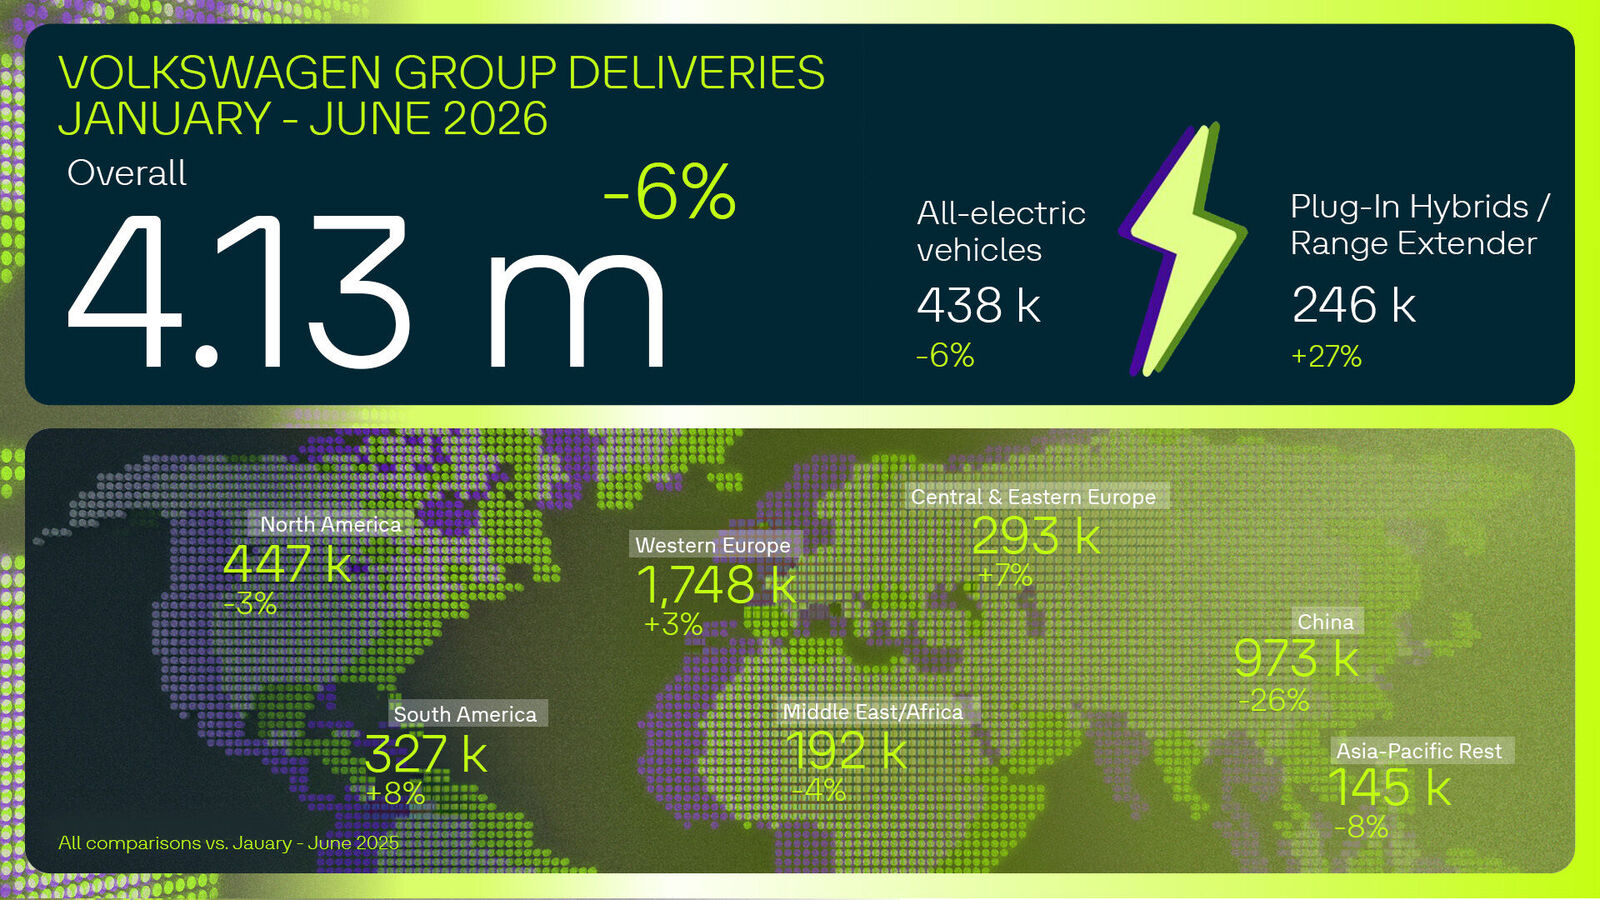
Growth in South America (+8 percent), Western Europe (+3 percent), and Central and Eastern Europe (+7 percent) only partially offset significant decline in China (-26 percent) driven by total market development; North America, after 8 percent growth in Q2, saw only a slight decline after six months (-3 percent)
Wolfsburg. On July 10, 2026, the Volkswagen Group published the deliveries for the first half of 2026.
“The Volkswagen Group grew by around two percent overall in the first half of the year outside of China. We continued to gain ground, particularly in South America and Europe. It is especially pleasing to note that in our home region, the Electric Urban Car Family - launched just a few weeks ago - is being very well received by our customers. We have already taken more than 54,000 orders for these attractive entry-level vehicles from VW, Škoda, and CUPRA, even though only three of the four models are currently available. This is well above our expectations. The order book for all-electric vehicles in Europe has risen by more than 50 percent overall compared to the end of last year. The situation in China remains challenging, where we were unable to escape a significant total market decline of around 20 percent - despite initial positive momentum from our newly introduced, locally developed electric vehicles. Globally, we are seeing a decline in deliveries of around six percent.”
Key figures
The Volkswagen Group remains the clear BEV market leader in Europe and continues on a growth trajectory (+8 percent); BEV share in Western Europe rises from 20 to 21 percent; in China, despite a significant decline, the first signs of positive momentum from the new, locally developed electric models can be seen in Q2; BEV total market in the U.S. declines significantly in the first half of the year following the expiration of government subsidy programs, including the impact of increased tariffs, BEV deliveries there fell by 69 percent
BEV order intake in Europe rises by more than 50 percent in Q2 compared to the same period last year; in particular, the recently launched Electric Urban Car Family - featuring the VW ID. Polo, Škoda Epiq and CUPRA Raval – is being very well received by customers, with more than 54,000 orders; order intake across all powertrains rises by 4 percent, order bank increases by about 12 percent compared to the end of 2025, BEV share of the order bank exceeds 30 percent
Demand for vehicles with modern second-generation plug-in hybrid (PHEV) powertrains and range extender (EREV) powertrains is rising; the first EREV model ID. ERA 9X has already seen more than 10,000 deliveries in China
Development of core regions
Europe
In the region, deliveries rose by 3.5 percent compared to the same period last year, reaching 2,041,000 vehicles. Western Europe saw an increase of 2.9 percent, while in Central and Eastern Europe, growth was even higher at 7.2 percent. In the home market of Germany, 2.7 percent more vehicles were handed over to customers.
North America
447,500 customers took delivery of a vehicle from a Group brand, a decrease of 3.1 percent compared with the same period last year. The trend has most recently been positive, with a 7.7 percent increase in Q2. In the key market USA, sales declined by 7.4 percent in the first half of the year amid a challenging environment. This was characterized by the tariff situation as well as changes in regulations.
South America
The Volkswagen Group delivered 327,200 vehicles in the region, representing an 8.3 percent increase over the previous year. In the key market of Brazil, growth was 17.1 percent.
Asia-Pacific
In the region, deliveries fell by 24.0 percent compared to the same period last year, to 1,118,300 units. The Volkswagen Group was unable to escape the significant decline in the Chinese totalmarket and recorded a 25.9 percent drop in deliveries.
Best-selling all-electric vehicles (BEV)
Škoda Elroq 59,900
Volkswagen ID.4/ID.5 53,700
Škoda Enyaq (including Coupé) 48,300
Volkswagen ID.3 44,400
Audi Q4 e-tron (SUV/Sportback) 33,800
Audi Q6 e-tron (SUV/Sportback) 31,900
Volkswagen ID.7 (including Tourer) 29,500
Volkswagen ID. Buzz (including Cargo) 27,200
CUPRA Born 20,800
Audi A6 e-tron (Avant/Sportback) 18,400
Deliveries Volkswagen Group – All drive types
Deliveries to customers by market | Apr. – Jun. 2026 | Apr. – Jun. 2025 | Delta (%) | Jan. – Jun. 2026 | Jan. – Jun. 2025 | Delta (%) |
Western Europe | 900,600 | 884,600 | +1.8 | 1,748,400 | 1,698,600 | +2.9 |
Central and Eastern Europe | 157,200 | 147,300 | +6.7 | 292,600 | 273,100 | +7.2 |
North America | 242,000 | 224,700 | +7.7 | 447,500 | 461,900 | -3.1 |
South America | 179,300 | 163,900 | +9.4 | 327,200 | 302,100 | +8.3 |
China | 424,300 | 669,700 | -36.6 | 973,000 | 1,313,800 | -25.9 |
Rest of Asia-Pacific | 75,100 | 80,800 | -7.2 | 145,300 | 157,200 | -7.5 |
Middle East/Africa | 98,900 | 100,800 | -1.9 | 191,700 | 198,800 | -3.6 |
World | 2,077,400 | 2,271,800 | -8.6 | 4,125,700 | 4,405,400 | -6.3 |
Deliveries to customers by brand | Apr. – Jun. 2026 | Apr. – Jun. 2025 | Delta (%) | Jan. – Jun. 2026 | Jan. – Jun. 2025 | Delta (%) |
Brand Group Core | 1,561,300 | 1,711,400 | -8.8 | 3,115,000 | 3,311,800 | -5.9 |
Volkswagen Passenger Cars | 1,019,900 | 1,186,200 | -14.0 | 2,067,500 | 2,320,300 | -10.9 |
Škoda | 283,800 | 270,800 | +4.8 | 555,700 | 509,400 | +9.1 |
SEAT/CUPRA | 154,400 | 155,900 | -0.9 | 299,700 | 302,600 | -1.0 |
Volkswagen Commercial Vehicles | 103,300 | 98,700 | +4.7 | 192,200 | 179,400 | +7.1 |
Brand Group Progressive | 372,000 | 405,300 | -8.2 | 736,900 | 794,100 | -7.2 |
Audi | 367,100 | 400,100 | -8.2 | 727,200 | 783,500 | -7.2 |
Bentley | 2,100 | 2,500 | -17.2 | 4,200 | 4,900 | -13.6 |
Lamborghini | 2,800 | 2,700 | +3.2 | 5,400 | 5,700 | -4.6 |
Brand Group Sport Luxury | 61,300 | 74,900 | -18.2 | 122,300 | 146,400 | -16.5 |
Porsche | 61,300 | 74,900 | -18.2 | 122,300 | 146,400 | -16.5 |
Brand Group Trucks / TRATON | 82,900 | 80,100 | +3.5 | 151,500 | 153,100 | -1.1 |
Scania | 26,300 | 24,700 | +6.7 | 47,200 | 46,800 | +0.8 |
MAN | 27,300 | 26,400 | +3.5 | 50,900 | 47,000 | +8.3 |
International | 16,200 | 17,600 | -8.3 | 29,500 | 34,500 | -14.6 |
Volkswagen Truck & Bus | 13,100 | 11,400 | +14.9 | 23,800 | 24,800 | -3.8 |
Volkswagen Group (total) | 2,077,400 | 2,271,800 | -8.6 | 4,125,700 | 4,405,400 | -6.3 |
Percentage changes are based on unrounded figures.
Volkswagen Group deliveries – all-electric vehicles (BEV)
Deliveries to customers by market | Apr. – Jun. 2026 | Apr. – Jun. 2025 | Delta (%) | Jan. – Jun. 2026 | Jan. – Jun. 2025 | Delta (%) |
Europe | 200,700 | 189,800 | +5.7 | 377,000 | 347,900 | +8.4 |
USA | 5,800 | 11,400 | -49.0 | 9,800 | 31,300 | -68.8 |
China | 21,500 | 33,400 | -35.6 | 30,900 | 59,400 | -47.9 |
Rest of the World | 10,400 | 14,200 | -26.4 | 20,700 | 27,000 | -23.2 |
World | 238,400 | 248,800 | -4.2 | 438,500 | 465,600 | -5.8 |
Deliveries to customers by brand | Apr. – Jun. 2026 | Apr. – Jun. 2025 | Delta (%) | Jan. – Jun. 2026 | Jan. – Jun. 2025 | Delta (%) |
Brand Group Core | 172,900 | 177,300 | -2.5 | 317,900 | 328,800 | -3.3 |
Volkswagen Passenger Cars | 75,900 | 97,500 | -22.2 | 138,300 | 192,700 | -28.2 |
Škoda | 56,400 | 46,000 | +22.7 | 108,200 | 73,000 | +48.3 |
SEAT/CUPRA | 22,500 | 19,000 | +18.5 | 40,300 | 37,600 | +7.2 |
Volkswagen Commercial Vehicles | 18,000 | 14,800 | +21.6 | 31,100 | 25,500 | +22.0 |
Brand Group Progressive | 53,000 | 55,000 | -3.7 | 95,000 | 101,400 | -6.3 |
Audi | 53,000 | 55,000 | -3.7 | 95,000 | 101,400 | -6.3 |
Bentley | - | - | - | - | - | - |
Lamborghini | - | - | - | - | - | - |
Brand Group Sport Luxury | 11,600 | 15,800 | -26.9 | 23,700 | 34,200 | -30.8 |
Porsche | 11,600 | 15,800 | -26.9 | 23,700 | 34,200 | -30.8 |
Brand Group Trucks / TRATON | 1,000 | 600 | +62.2 | 1,900 | 1,200 | +51.4 |
Scania | 270 | 120 | +126.5 | 400 | 220 | +78.7 |
MAN | 560 | 430 | +30.3 | 1,100 | 800 | +36.7 |
International | 210 | 90 | +126.9 | 390 | 180 | +120.1 |
Volkswagen Truck & Bus | 0 | 0 | +100.0 | 10 | 50 | -87.2 |
Volkswagen Group (total) | 238,400 | 248,800 | -4.2 | 438,500 | 465,600 | -5.8 |
Percentage changes are based on unrounded figures.
Overview:
1. How many vehicles did Volkswagen Group deliver in the first half of 2026?
Volkswagen Group delivered around 4.1 million vehicles worldwide. This was 6% lower than in the same period last year.
2. How is the demand for Volkswagen Group electric vehicles evolving in Europe?
Volkswagen Group’s order backlog for fully electric vehicles in Europe increased by more than 50%. The new Electric Urban Car Family has attracted more than 54,000 orders.
3. Why did Volkswagen Group deliveries decline in China?
Volkswagen Group deliveries in China fell by 25.9% due to a significantly weaker overall market. This happened despite early positive momentum from newly launched, locally developed electric vehicles