


Interim report January-September 2024
The Volkswagen Group has published its financial results for the third quarter of 2025.
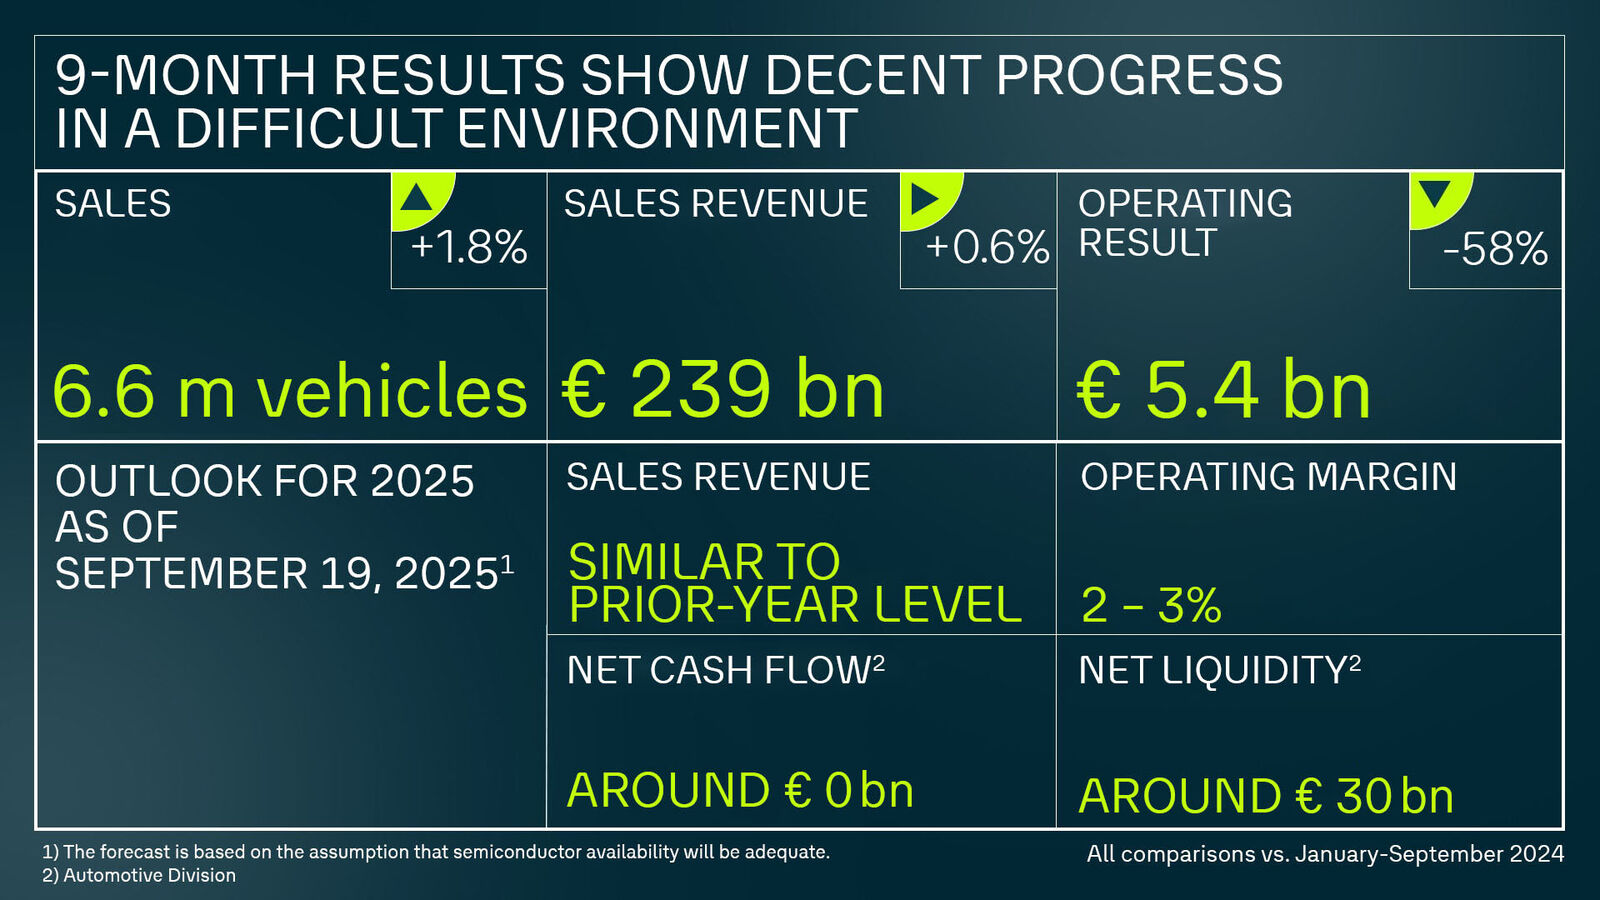
Wolfsburg. The Volkswagen Group has published its financial results for the first nine months of 2025.
“In the first nine months of the year, we have seen a mixed picture. On the one hand, there is the market success of our combustion engine and electric vehicles, as well as good progress with restructuring. On the other hand, the financial result is significantly weaker compared to the previous year. This is partly due to the ramp-up of lower-margin electric vehicles. Additionally, we recorded charges, primarily from increased tariffs and the adjustment of the product strategy at Porsche. Excluding these charges, the Group operating margin is 5.4 percent – at first glance a respectable figure in the current economic environment. But increased trading tariffs burden us by up to 5 billion EUR on a full-year basis. Those effects will continue to persist – and that is why we must rigorously implement the performance programs in place, push forward efficiency measures and develop new approaches. Our focus will be – amongst others – on the targeted use of our scale and exploiting synergies within the Group even more effectively.”
The Volkswagen Group expects its sales revenue for 2025 to be in line with the previous year. The Group’s operating return on sales is projected to range between 2.0 and 3.0 percent.
In the Automotive Division, the company expects an investment ratio between 12 and 13 percent in 2025. Net cash flow for the year 2025 is expected to be around EUR 0 billion. This includes cash outflows for future-oriented investments as well as for restructuring measures. Net liquidity in the Automotive Division is expected to amount to around EUR 30 billion in 2025. The Volkswagen Group continues to pursue its objective of maintaining a solid financing and liquidity policy.
The forecast is based on the assumption of adequate availability of semiconductors.
Note: As of January 2025, adjustments to the reporting logic will lead to more transparent disclosure of sales revenue in the Automotive Division. Mathematically, this will result in a lower investment ratio – by 130 basis points to 13.0 percent in the 2024 fiscal year. Based on the adjusted reporting logic, the Group expects the investment ratio in the Automotive Division to decrease to between 12 and 13 percent in 2025 and to around 10 percent in 2027. For further details, see page 180 of the 2024 Annual Report.
Significant increase in unit sales and sales revenue led to an improvement of 7% in the operating result. The operating margin remained stable year-on-year at 4.4%, despite considerable headwinds from US import tariffs, restructuring expenses and the ramp up of lower-margin electric vehicles.
Despite the headwinds, Volkswagen passenger cars’ operating margin slightly improved to 2.3%, supported by strict cost discipline and implementation of the program “Zukunft Volkswagen”. Škoda’s profitability remained strong at 8%. SEAT/CUPRA and Volkswagen Commercial Vehicles came in below the prior year level.
Brand group Progressive’s operating result declined by 26% to EUR 1.6 billion. Positive effects from higher sales revenue were more than offset by charges related to US import tariffs, CO₂ regulation and the rescheduling of an electric platform for the Group’s D-segment. The operating margin decreased to 3.2% (–1.3 percentage points).
Porsche deliveries declined by 11% to around 198,000 units. Sales revenue decreased to EUR 23.8 billion, and the operating result stood at EUR –0.2 billion.
Key drivers included lower volumes due to the challenging market environment in China, expenses for the strategic realignment of the product portfolio and battery activities, US import tariffs, increased material costs, and higher capitalized development costs recognized in profit or loss.
TRATON recorded a significant decline in its operating result to EUR 1.7 billion (–46%), primarily due to lower volumes. The result was further impacted by customer and market mix effects, negative currency effects and the expansion of production in China.
Negative net cash flow of EUR –0.6 billion was driven by the lower operating performance and future-oriented investments.
The operating result increased by 37% to EUR 2.9 billion, driven by growth in Europe and improved margin quality. Contract volume rose by 4.6%.
Q3 | 9M | ||||||
2025 | 2024 | % | 2025 | 20241 | % | ||
Volume Data2 in thousands | |||||||
Deliveries to customers (units) | 2,199 | 2,176 | +1.0 | 6,604 | 6,524 | +1.2 | |
Vehicle sales (units) | 2,218 | 2,122 | +4.5 | 6,581 | 6,463 | +1.8 | |
Production (units) | 2,125 | 2,025 | +4.9 | 6,644 | 6,632 | +0.2 | |
Employees (on Sep. 30, 2025/Dec. 31, 2024) | 666.9 | 679.5 | –1.9 | ||||
Financial Data (IFRS), € million | |||||||
Sales revenue | 80,305 | 78,478 | +2.3 | 238,669 | 237,279 | +0.6 | |
Operating result | -1,299 | 2,833 | - | 5,408 | 12,812 | –57.8 | |
Operating return on sales (%) | -1.6 | 3.6 | 2.3 | 5.4 | |||
Earnings before tax | -364 | 2,331 | - | 6,059 | 12,408 | –51.2 | |
Return on sales before tax (%) | -0.5 | 3.0 | 2.5 | 5.2 | |||
Earnings after tax | -1,072 | 1,558 | - | 3,405 | 8,836 | -61.5 | |
Automotive Division | |||||||
Cash flows from operating activities | 8,521 | 9,435 | -9.7 | 18,931 | 21,509 | –12.0 | |
Cash flows from investing activities attributable to operating activities3 | 5,374 | 6,427 | -16.4 | 17,134 | 18,134 | -5.5 | |
Net cash flow | 3,147 | 3,008 | +4.6 | 1,797 | 3,375 | -46.8 | |
Net liquidity at Sep. 30 / Dec. 31 | 31,008 | 32,829 | –5.5 | ||||
Investment ratio | 11.4 | 12.9 | 11.4 | 12.5 | |||
1) Prior year has been adjusted (see explanations to IAS 8).
2) The figures also include the equity-accounted Chinese joint ventures. Prior-year deliveries have been updated to reflect subsequent statistical trends.
3) Excluding acquisition and disposal of equity investments: Q3 EUR -5,230 (-6,013) million, January to September EUR -15,627 (-16,881) million.
Vehicle sales | Sales revenue | Operating result | Operating margin | |||||
Thousand vehicles/€ million | 2025 | 2024 | 2025 | 2024 | 2025 | 20241 | 2025 | 2024 |
Core brand group | 3,771 | 3,627 | 106,950 | 101,523 | 4,719 | 4,419 | 4.4 | 4.4 |
Progressive brand group | 848 | 800 | 48,380 | 46,262 | 1,555 | 2,088 | 3.2 | 4.5 |
Sport Luxury brand group2 | 198 | 221 | 23,833 | 25,899 | -228 | 3,771 | -1.0 | 14.6 |
CARIAD | – | – | 960 | 652 | -1,500 | -2,058 | – | – |
Battery | – | – | 26 | 1 | -1,054 | -371 | – | – |
TRATON Commercial Vehicles | 225 | 246 | 31,188 | 34,266 | 1,685 | 3,097 | 5.4 | 9.0 |
Equity-accounted companies in China3 | 1,882 | 1,903 | – | – | – | – | – | – |
Volkswagen Group Mobility | – | – | 44,140 | 40,959 | 2,893 | 2,113 | 6.6 | 5.2 |
Other4 | -344 | -335 | -16,810 | -12,283 | -2,662 | -246 | - | - |
Volkswagen Group | 6,581 | 6,463 | 238,669 | 237,279 | 5,408 | 12,812 | 2.3 | 5.4 |
1) Prior year has been adjusted.
2) Including Porsche Financial Services: sales revenue EUR 26,864 (28,564) million, operating result EUR 40 (4,035) million.
3) The sales revenue and operating result of the equity-accounted companies in China are not included in the consolidated figures; the share of the operating result generated by these companies amounted to EUR 744 (1,179) million.
4) In the operating result, mainly intragroup items recognized in profit or loss, in particular from the elimination of intercompany profits; the figure includes depreciation and amortization of identifiable assets as part of purchase price allocation, as well as companies not allocated to the brands.